
Equal Highs & Lows
Equal Highs & Lows
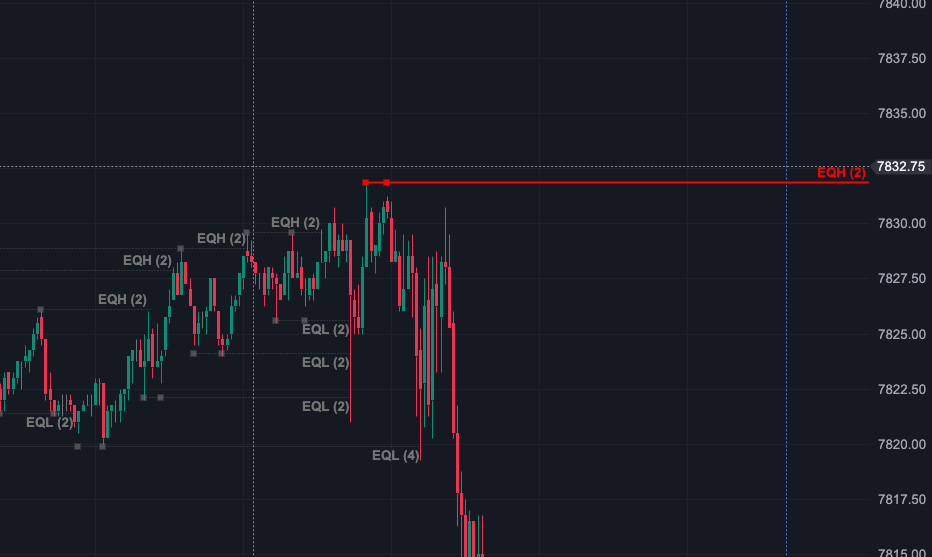
Equal Highs & Lows is a market structure indicator designed to automatically identify and visualize equal highs and equal lows on the chart.
These levels can represent areas where liquidity is concentrated and can provide valuable reference points for liquidity sweeps, breakouts, reversals and potential price targets.
Key Features
* Equal High Detection — automatically identifies multiple highs formed at approximately the same price level.
* Equal Low Detection — identifies multiple lows formed at approximately the same price level.
* Liquidity Visualization — clearly highlights areas where multiple swing points are concentrated around the same price.
* Configurable Tolerance — allows you to define how close highs or lows must be to each other to qualify as equal.
* Automatic Detection — continuously scans the chart for newly formed equal highs and lows.
* Live Updates — newly developing levels are detected in real time as market structure forms.
* Clean Chart Visualization — provides an easy-to-read representation of important equal-price levels without unnecessary chart clutter.
Why Use It?
Equal highs and lows often attract attention because multiple swing points around the same price can indicate potential liquidity resting above or below the market.
The indicator automatically identifies these areas so you can monitor them as potential liquidity targets, sweep zones, reaction levels or structural reference points.
Instead of manually searching for repeated highs and lows, Equal Highs & Lows continuously scans the market and highlights these levels directly on your chart.
ATAS License Requirement
To ensure the indicator is correctly assigned to your ATAS account, you must enter the same email address during checkout that is registered with your ATAS license.
This email is required so the indicator can be properly linked to your ATAS account.
Important: If you enter a different email address, I may not be able to correctly assign the indicator to your ATAS license.
Important
This indicator is a digital product/license intended for use with ATAS. After purchase, the indicator will be assigned to the ATAS account associated with the email address provided during checkout.
$49.00
Untested Sessions Levels (NY, London/Overnight and Asia)
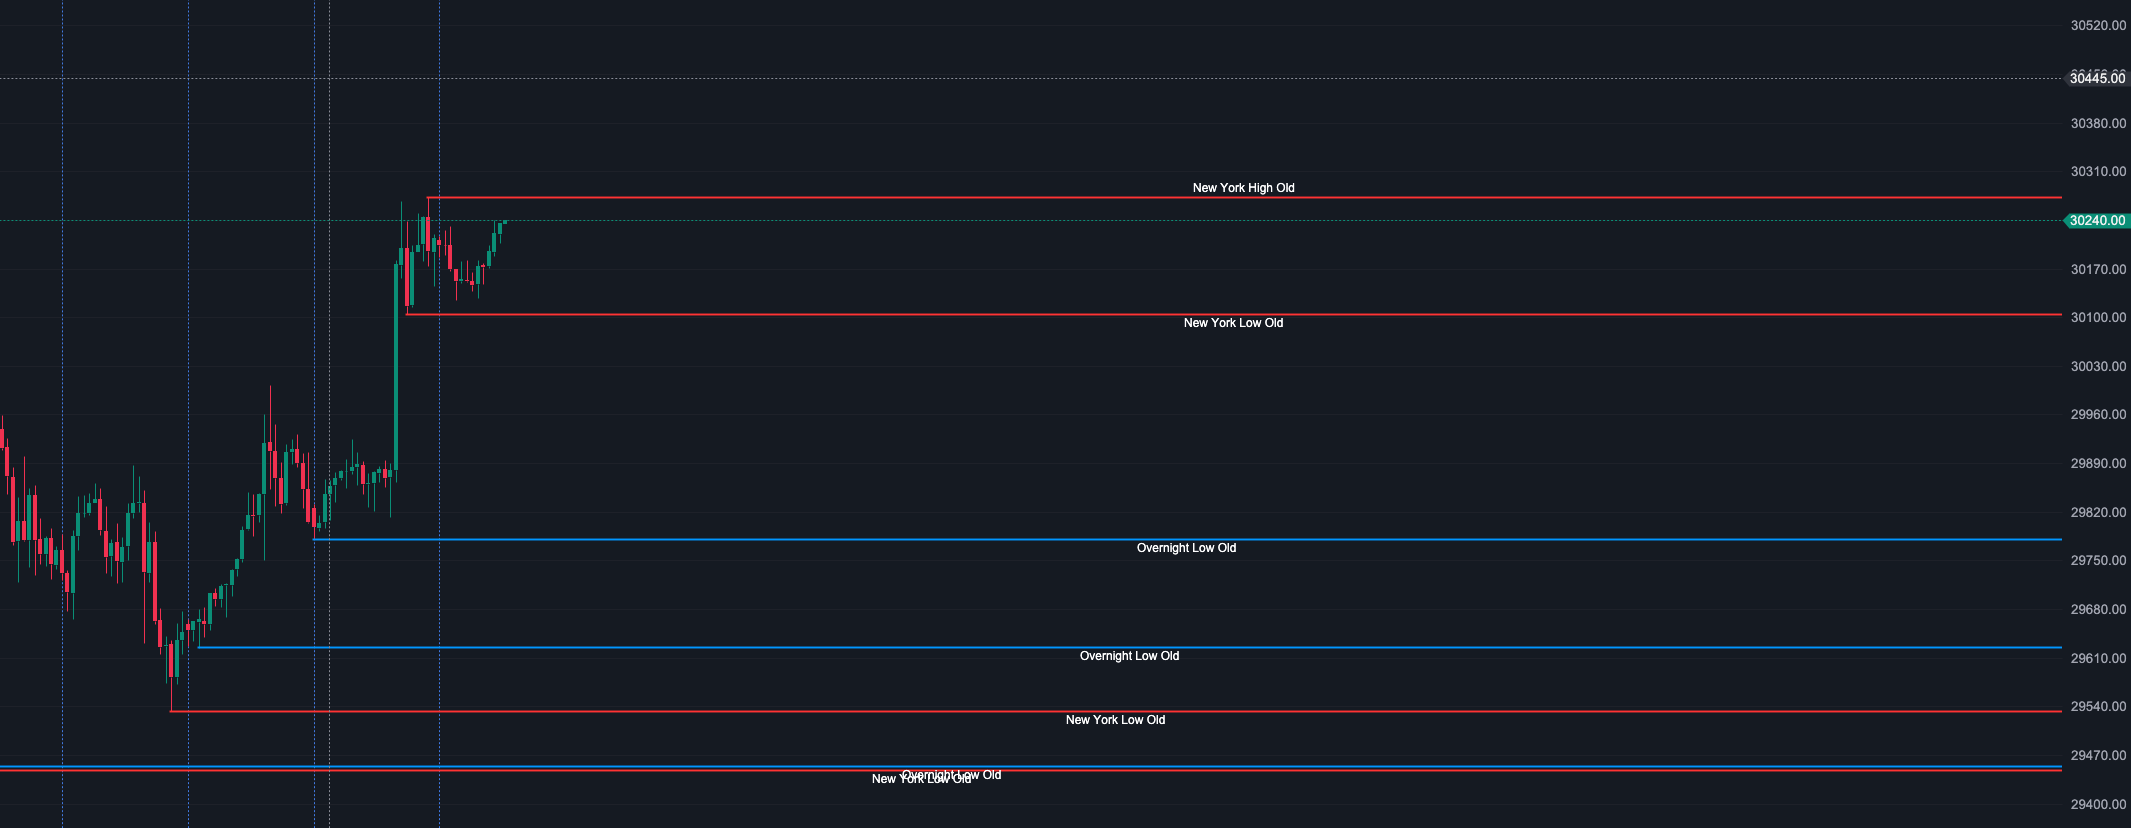
Indicator Name: Untested Session LevelsUntested Session Levels is a session-based indicator that identifies and tracks untested highs and lows from up to three configurable trading sessions:New YorkLondon / OvernightAsiaIt highlights key liquidity levels that price has not yet revisited, giving traders clear reference points for potential reactions, liquidity sweeps, and future price targets.Key FeaturesDisplay up to three sessions simultaneously: New York, London/Overnight, and Asia.Automatically identifies untested session highs and lows.Fully configurable session times.Tracks new highs and lows live as each session develops.Keeps levels visible until price tests them.Supports historical untested levels for additional market context.Clean chart visualization, with clearly separated levels for each session.Why Use It?Untested session highs and lows often serve as important liquidity reference points during the trading day. This indicator makes them immediately visible, helping traders identify untouched liquidity, potential targets, reaction zones, and confirmation levels.ATAS License RequirementTo assign the indicator correctly to your ATAS account, enter the same email address at checkout that is registered with your ATAS license.Important: If you use a different email address, the indicator may not be assigned correctly to your ATAS license.ImportantThis is a digital product/license intended for use with ATAS. After purchase, the indicator will be assigned to the ATAS account associated with the email address provided during checkout.
$99.00
Absorption candle visual
Absorption Candle
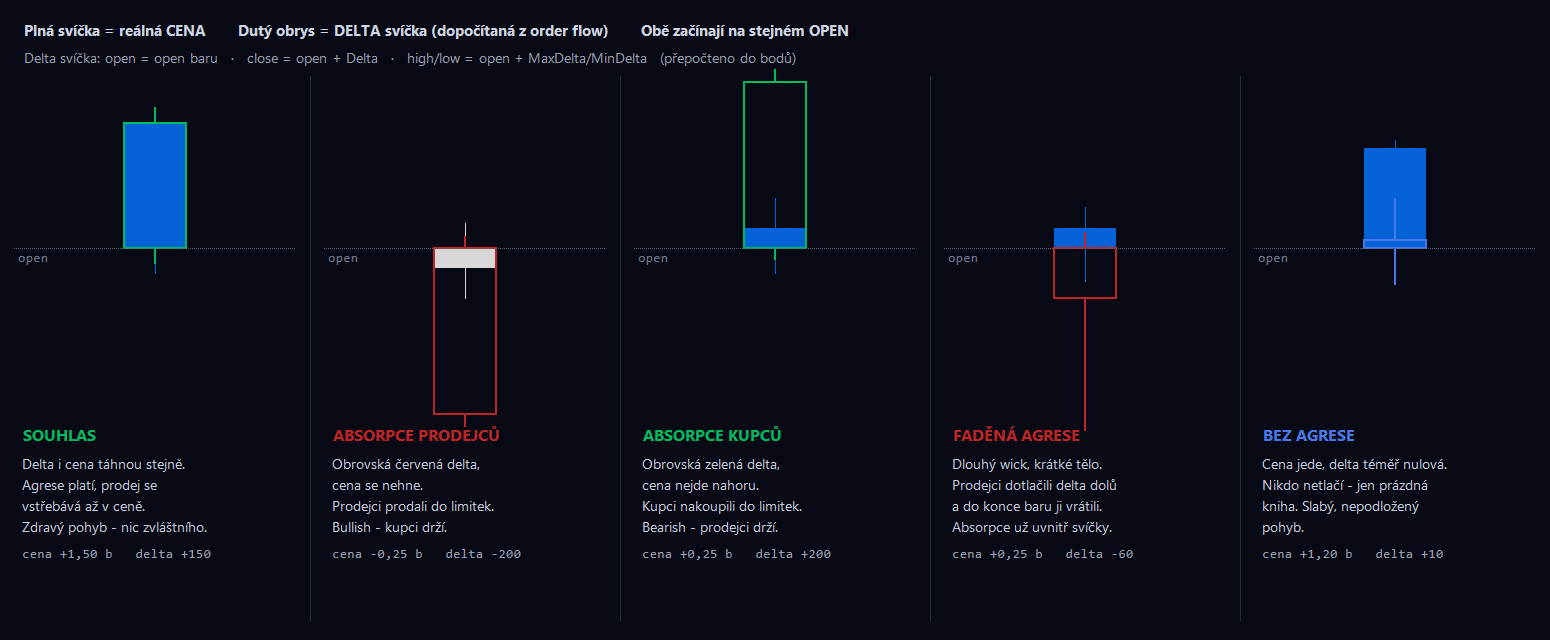
Absorption Candle is an order-flow visualization indicator designed to make absorption easier to identify by transforming the visual appearance of candles according to their delta.
Instead of displaying only the actual price structure of the candle, the indicator creates a delta-based candle representation, allowing traders to immediately see the relationship between aggressive buying/selling pressure and the resulting price movement.
Key Features
* Delta-Based Candle Shape — displays the candle’s visual size and structure according to its delta, rather than only its actual price range.
* Delta vs. Price Comparison — makes it easier to recognize situations where significant aggressive buying or selling occurs without a corresponding price movement.
* Absorption Identification — highlights potential absorption where aggressive market orders are being absorbed by passive liquidity.
* Visual Order-Flow Representation — converts complex delta information into an intuitive candle format that can be read directly from the chart.
* Live Visualization — the delta-based candle develops in real time while the candle is forming, allowing absorption to be monitored as it occurs.
* Works Alongside Standard Candles — the delta representation provides additional information while preserving the context of the actual market price.
Why Use It?
Absorption can be difficult to identify when looking at standard price candles alone.
Absorption Candle provides a second perspective: instead of asking only where price moved, you can see how aggressive buyers and sellers were behaving relative to that movement.
When the delta-based candle looks significantly different from the actual price candle, it can reveal an imbalance between aggressive order flow and price response — an important characteristic of potential absorption.
ATAS License Requirement
To ensure the indicator is correctly assigned to your ATAS account, you must enter the same email address during checkout that is registered with your ATAS license.
This email is required so the indicator can be properly linked to your ATAS account.
Important: If you enter a different email address, I may not be able to correctly assign the indicator to your ATAS license.
Important
This indicator is a digital product/license intended for use with ATAS. After purchase, the indicator will be assigned to the ATAS account associated with the email address provided during checkout.
$99.00
VWAP PLUS
VWAP Plus
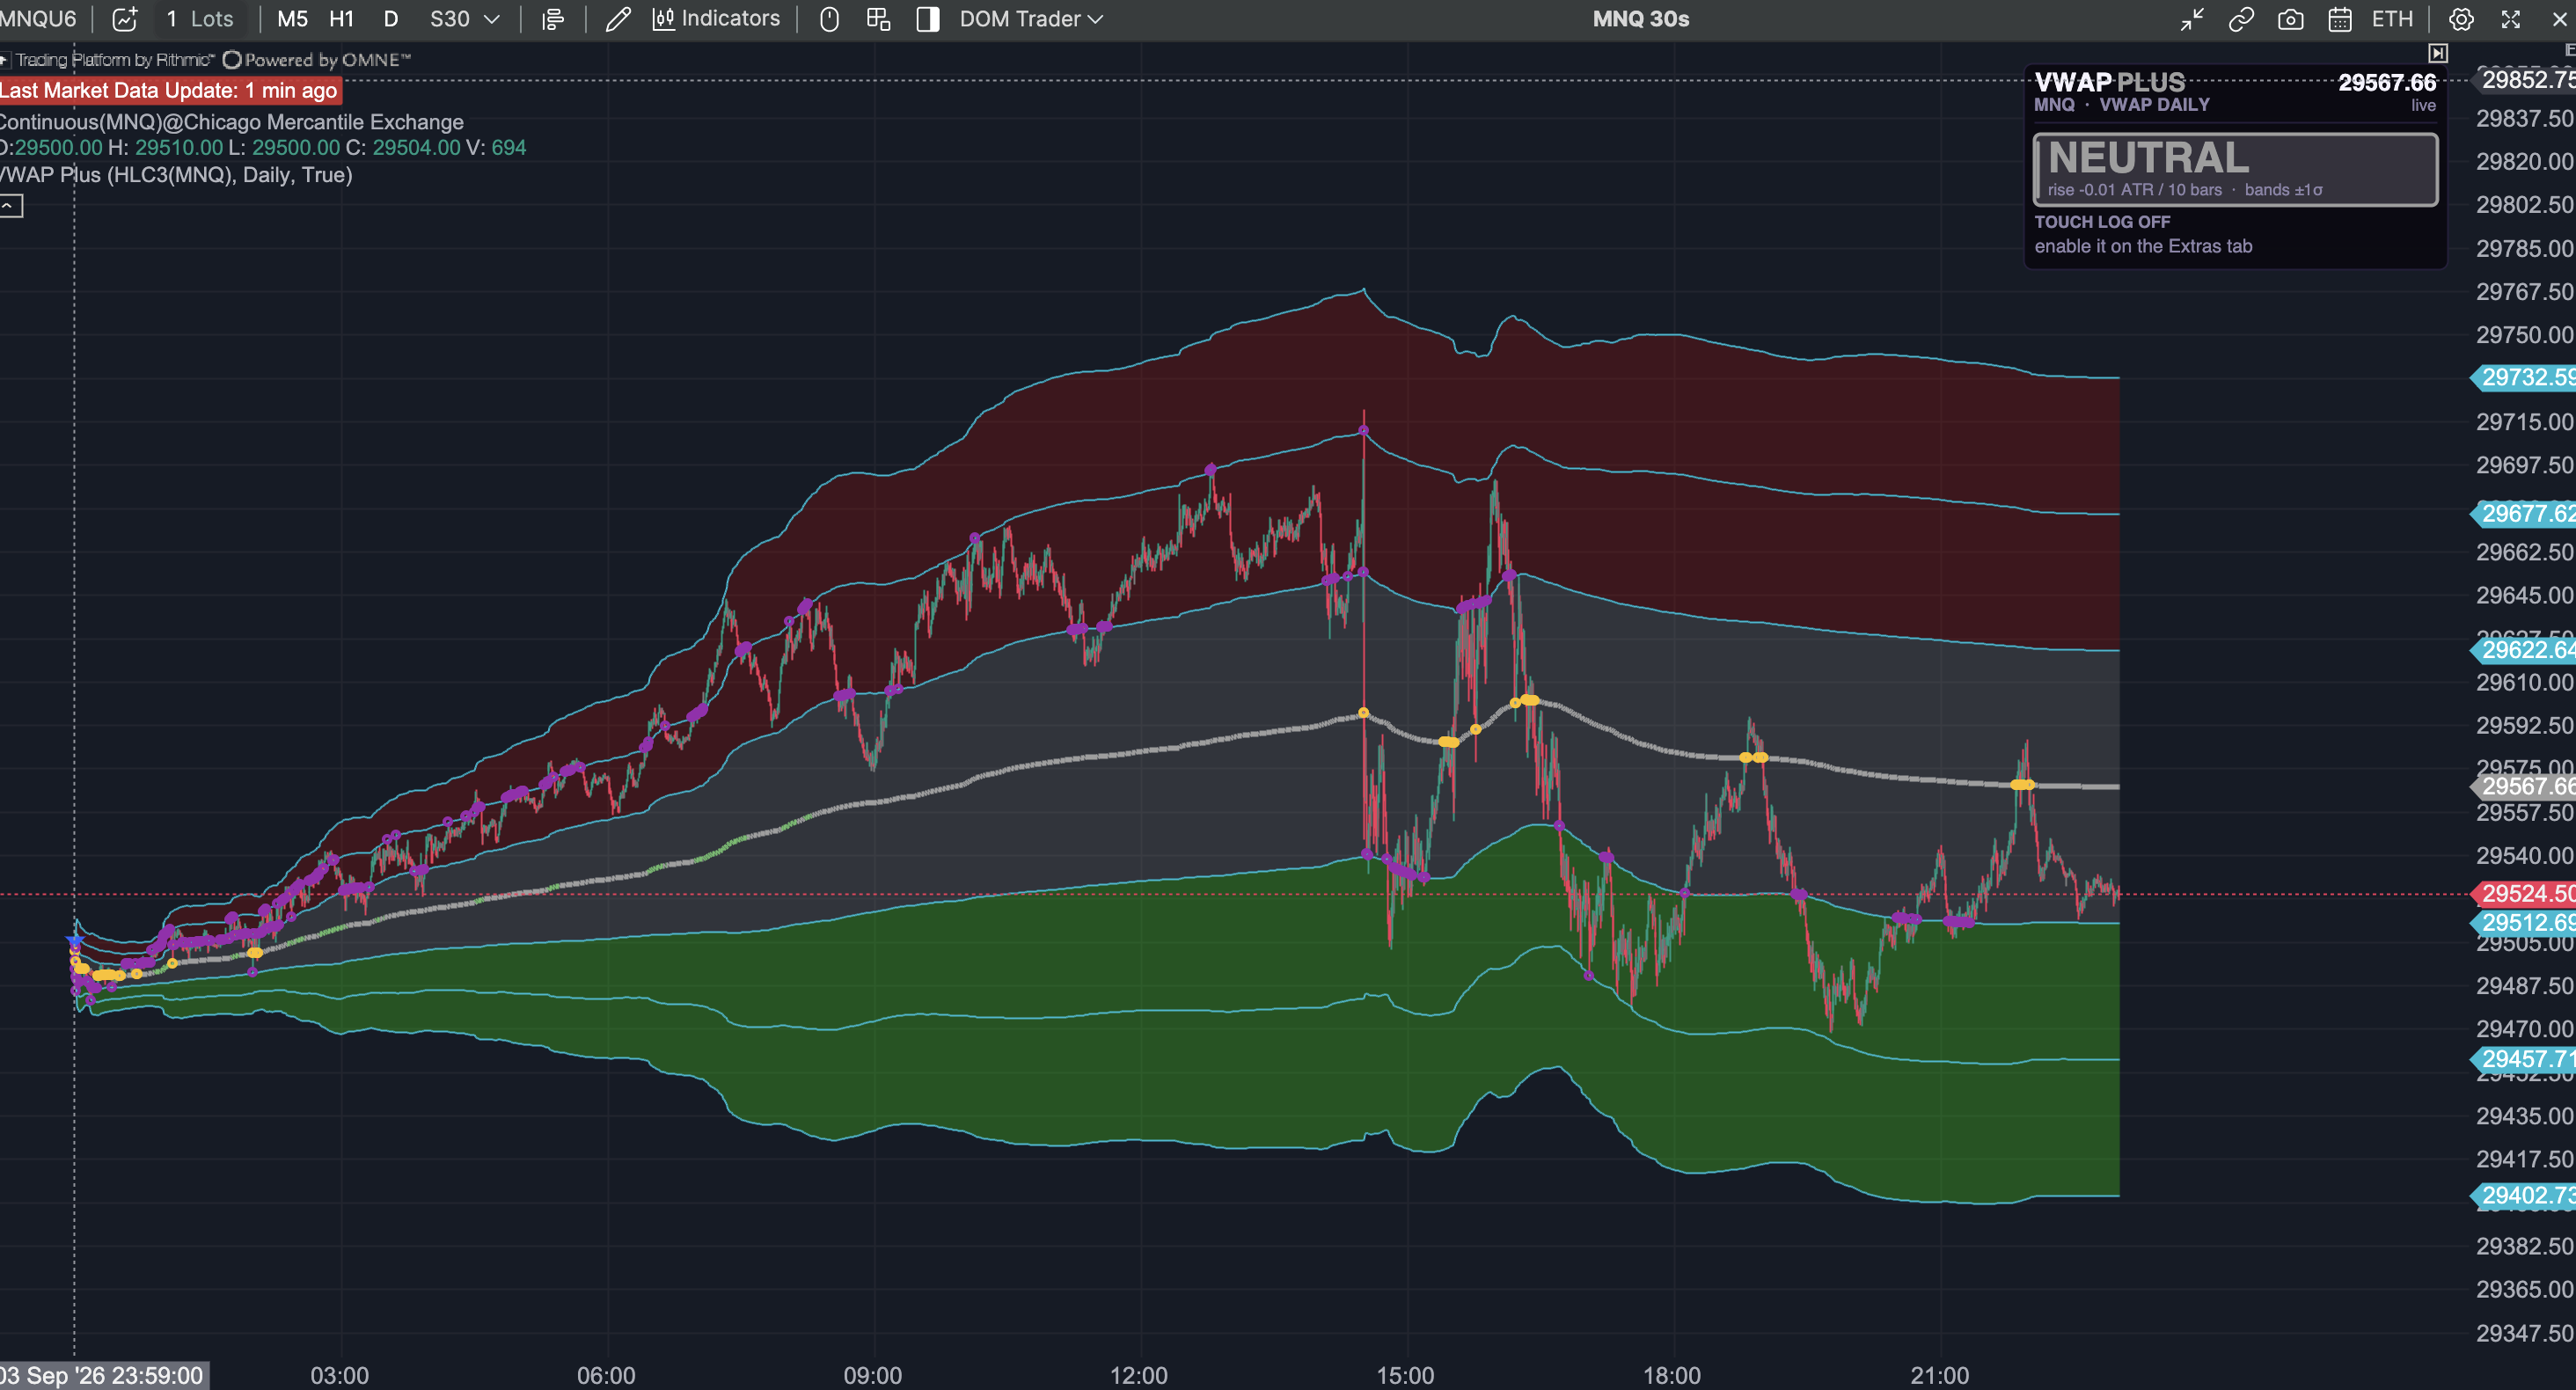
**VWAP Plus** is an advanced version of the classic VWAP indicator, designed to provide a clearer view of VWAP interactions, deviations, and overall market direction.
Instead of simply displaying VWAP, VWAP Plus actively identifies and marks **price touches of VWAP and its deviation bands**, allowing you to quickly see where price repeatedly interacts with these important dynamic levels.
### Key Features
**VWAP & Deviation Touches**
Automatically identifies and marks every relevant price touch of VWAP and its deviation bands, giving you a clear visual representation of how price interacts with these levels.
**Touch Alerts**
Set customizable alerts for VWAP and deviation touches. You can be notified when price reaches the levels you're interested in without having to constantly monitor the chart.
**Custom Sessions**
Fully customizable session settings allow you to configure VWAP calculations according to your preferred trading hours and market session.
**VWAP Trend Analyzer**
VWAP Plus includes a built-in **VWAP Trend Analyzer** that analyzes the direction and slope of VWAP in real time.
The dedicated panel displays:
- **VWAP trend direction**
- **VWAP slope**
- **Current VWAP trend condition**
To make the information immediately visible, **VWAP itself dynamically changes color according to the current trend**, allowing you to recognize the market direction at a glance.
### Built for Smarter VWAP Analysis
VWAP Plus combines **VWAP, deviation levels, touch detection, customizable alerts, session control, and real-time trend analysis** into one powerful indicator.
Whether you use VWAP as a key intraday level, mean-reversion reference, trend filter, or part of your execution strategy, VWAP Plus provides the additional information needed to analyze these levels more efficiently.
**More than just VWAP. It's VWAP Plus.**
ATAS License Requirement
To ensure the indicator is correctly assigned to your ATAS account, you must enter the same email address during checkout that is registered with your ATAS license.
This email is required so the indicator can be properly linked to your ATAS account.
Important: If you enter a different email address, I may not be able to correctly assign the indicator to your ATAS license.
Important
This indicator is a digital product/license intended for use with ATAS. After your purchase, the indicator will be assigned to the ATAS account associated with the email address provided during checkout.
$99.00
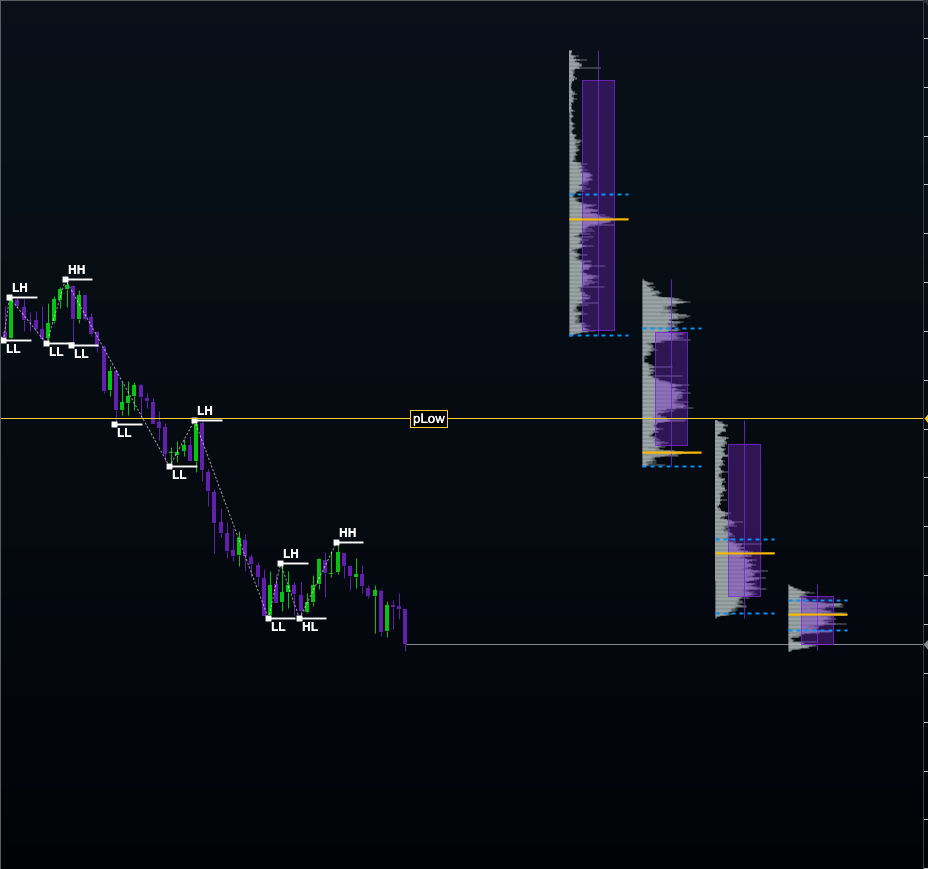
Higher TimeFrame Candles
Higher Timeframe Candles & Volume Profile
Display higher-timeframe candles directly on any chart, including their Volume Profile, to give you a clear view of the broader market context without switching timeframes.
Fully configurable settings allow you to choose the higher timeframe, number of candles, colors, transparency, Volume Profile visibility and other visual parameters. A powerful tool for understanding market structure, key areas and higher-timeframe context directly within your current chart.
Important: The email address used for your order must be the same email address registered with ATAS. Otherwise, the license cannot be assigned correctly.
$129.00
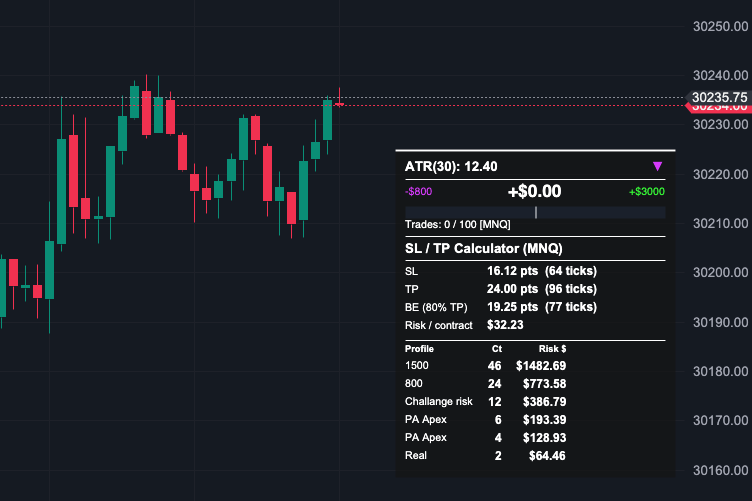
ATR Risk calculator + manager
ATR Risk Calculator
ATR Risk Calculator is an advanced position sizing and risk management indicator designed to automatically calculate the appropriate position size based on ATR, a predefined risk amount and a configurable ATR multiplier.
The indicator helps traders maintain consistent risk across trades while adapting position size to current or historical market volatility.
Key Features
* Automatic Position Sizing — calculates the appropriate position size based on your predefined monetary risk.
* ATR-Based Risk Calculation — position size is calculated using the selected ATR value and your chosen ATR multiplier.
* Current ATR — calculate position size using the current market ATR.
* Historical ATR — alternatively, use historical ATR data for a more consistent and predefined risk calculation.
* Custom Risk — set the maximum amount you are willing to risk per trade.
* Adjustable ATR Multiplier — configure the ATR coefficient according to your trading strategy and desired stop-loss distance.
* Dynamic Risk Adjustment — position size automatically adapts as market volatility changes.
Built-In Risk Manager
ATR Risk Calculator also includes an integrated Risk Manager that allows you to define daily risk and performance limits.
You can configure parameters such as:
* Maximum Daily Loss
* Maximum Daily Profit
* Maximum Number of Trades
Once a predefined limit is reached, the Risk Manager can automatically restrict further trading to help protect your account and prevent excessive risk.
Why Use ATR Risk Calculator?
Market volatility changes constantly. A fixed position size therefore does not always represent the same level of risk.
ATR Risk Calculator automatically adjusts position size according to volatility, allowing you to maintain a more consistent predefined risk while adapting to changing market conditions.
ATAS License Requirement
To ensure the indicator is correctly assigned to your ATAS account, you must enter the same email address during checkout that is registered with your ATAS license.
This email is required so the indicator can be properly linked to your ATAS account.
Important: If you enter a different email address, I may not be able to correctly assign the indicator to your ATAS license.
Important
This indicator is a digital product/license intended for use with ATAS. After purchase, the indicator will be assigned to the ATAS account associated with the email address provided during checkout.
$135.00
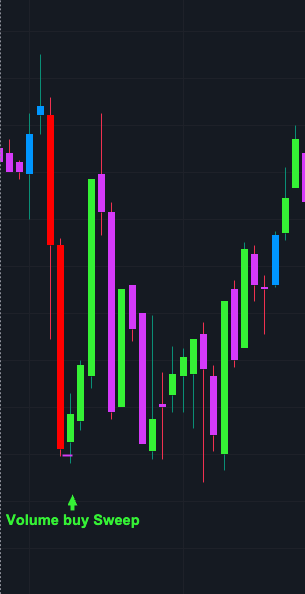
Volume Extremes and Entry Signals
Volume Extremes & Entry Signals
Volume Extremes & Entry Signals is an advanced volume-based indicator designed to identify exceptional volume activity and highlight potential trading opportunities directly on the chart.
The indicator compares current candle volume with historical volume activity to identify unusually high-volume candles and provides visual entry signals based on predefined conditions.
Key Features
* Volume Extremes — identifies candles with exceptionally high volume compared to the selected historical reference.
* Dynamic Volume Analysis — adapts to the market’s current volume conditions instead of relying only on fixed volume values.
* Extreme Volume Candles — clearly highlights candles where volume significantly exceeds normal activity.
* Entry Signals — generates visual entry signals when the defined volume conditions indicate a potential trading opportunity.
* Live Detection — volume extremes and qualifying entry conditions can be detected in real time while the candle is forming.
* Clear Visualization — makes abnormal volume activity immediately visible directly on the chart.
Why Use It?
Extreme volume often indicates a significant increase in market participation and can provide valuable context around important price movements.
Volume Extremes & Entry Signals helps traders quickly identify when the market is experiencing unusually high activity and combines this information with entry conditions to highlight potential setups.
Instead of manually comparing every candle’s volume with previous activity, the indicator automatically identifies statistically significant volume events and presents them directly on the chart.
ATAS License Requirement
To ensure the indicator is correctly assigned to your ATAS account, you must enter the same email address during checkout that is registered with your ATAS license.
This email is required so the indicator can be properly linked to your ATAS account.
Important: If you enter a different email address, I may not be able to correctly assign the indicator to your ATAS license.
Important
This indicator is a digital product/license intended for use with ATAS. After purchase, the indicator will be assigned to the ATAS account associated with the email address provided during checkout.
$169.00
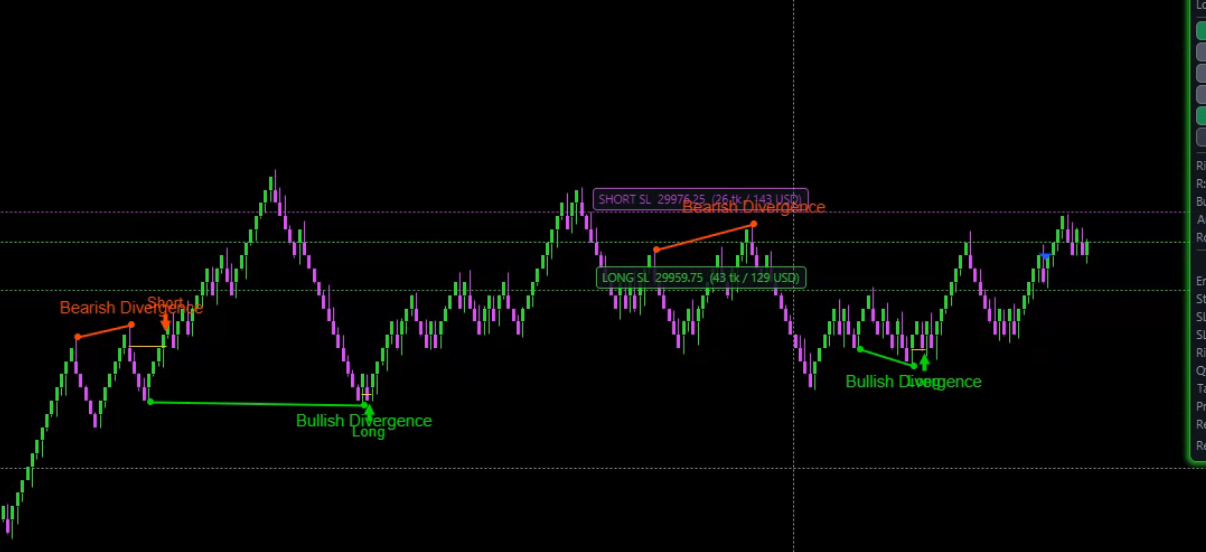
CVD Delta Price Divergence
CVD Delta Price Divergence
CVD Delta Price Divergence is an order-flow indicator designed to identify divergences between price movement and cumulative delta (CVD). It helps traders detect situations where price is moving in one direction while aggressive buying or selling pressure is developing in the opposite direction.
Key Features
* CVD vs. Price Divergence — identifies bullish and bearish divergences between price and CVD.
* Live Detection — divergence detection and visualization works in real time while the candle is forming, allowing you to monitor developing order-flow imbalances without waiting for the candle to close.
* Clear Visual Signals — divergences are displayed directly on the chart for fast identification.
* Order-Flow Based — uses CVD/delta information to provide additional context beyond price action alone.
* Suitable for Multiple Timeframes — can be used with different chart types and timeframes depending on your trading style.
ATAS License Requirement
To ensure the indicator is correctly assigned to your ATAS account, you must enter the same email address during checkout that is registered with your ATAS license.
This email is required so the indicator can be properly linked to your ATAS account.
Important: If you enter a different email address, I may not be able to correctly assign the indicator to your ATAS license.
Important
This indicator is a digital product/license intended for use with ATAS. After your purchase, the indicator will be assigned to the ATAS account associated with the email address provided during checkout.
$189.00
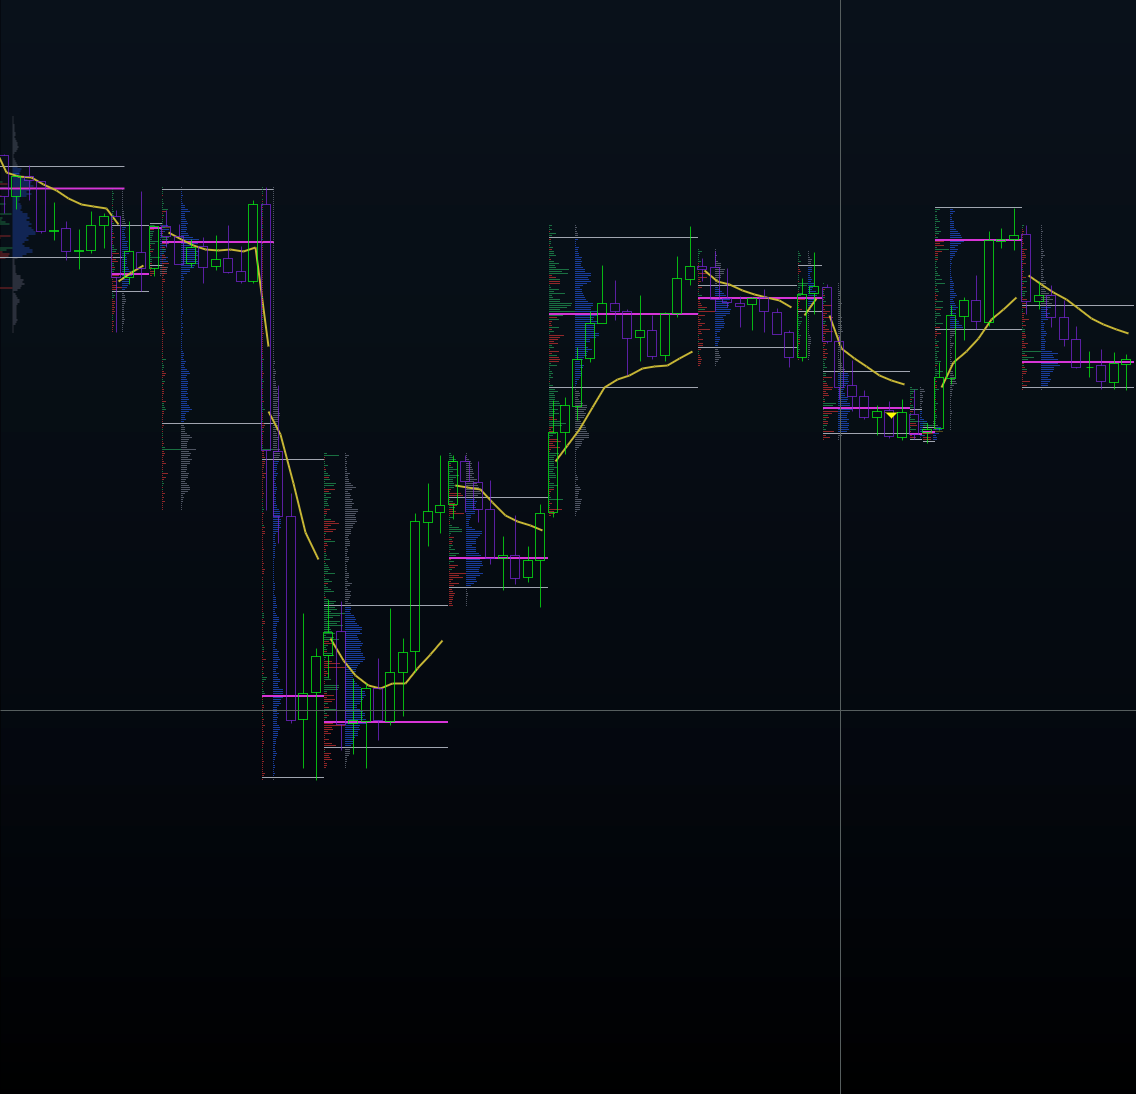
Deep Profile Swing
**See What Really Happened Inside Every Swing**
Most traders see price move. You see the volume that created it.
This indicator breaks every meaningful swing down into its internal volume structure—so you can immediately see where traders were active, where volume accumulated, and where price travelled with little real participation.
It also plots the **VWAP of every individual swing**, giving you an instant reference for the fair-value area of that move. See whether price is accepting above or below a swing’s VWAP, returning to it for a reaction, or rejecting it entirely.
For break-of-structure traders, this adds crucial context. A structure break backed by concentrated volume is not the same as a break that happened through thin, empty price levels. The chart shows you the difference at a glance.
**Built for Order-Flow Traders**
Designed for traders who read volume—not generic indicator signals.
Ideal for:
- Supply and demand traders validating zones with real participation
- Break-of-structure traders assessing the quality behind a breakout
- Scalpers looking for precise intraday volume context
- Swing traders tracking where larger moves established value
- Anyone who wants to stop treating every price move as equally meaningful
Configure the detector to match your style and market horizon—from fast scalps to broader swing structures.
**More Than a Volume Profile**
Every detected swing gets its own detailed volume profile, without manually drawing and managing profiles across the chart.
You can see:
- Volume distribution inside each move
- The VWAP of every swing
- High-volume areas where participation concentrated
- Low-volume areas where price moved quickly
- Whether a breakout was supported by meaningful volume or simply pushed through thin liquidity
- How price behaves when it returns to a prior swing’s value area
The result: cleaner context, faster decisions, and less guesswork.
**Technical Features**
- 80 settings across 11 sections—from swing detection to the color of every line
- Displays a dedicated volume profile and VWAP for each detected swing
- Works with time, tick, range, volume, and Renko charts
- Automatic row grouping adapts to your zoom level, keeping profiles readable at every scale
- Option to set a fixed number of ticks per row for full control
- Cached aggregation recalculates only when inputs actually change—not on every redraw
- Native .NET assembly built specifically for ATAS X, with no WPF dependencies
**What It Does—and What It Doesn’t**
This indicator does not promise profits. No tool creates an edge by itself.
What it does give you is information that a standard daily profile cannot: the volume structure and VWAP of each individual move. Use that context to validate your levels, judge momentum, and make more informed trading decisions.
**ATAS License Requirement**
To ensure the indicator is correctly assigned to your ATAS X account, please enter the same email address during checkout that is registered with your ATAS X license.
This email is required to link the indicator correctly to your ATAS X account.
**Important:** If you use a different email address, I may not be able to assign the indicator correctly to your ATAS X license.
**Important**
This indicator is a digital product/license intended for use with ATAS X. After purchase, it will be assigned to the ATAS X account associated with the email address entered during checkout.
$199.00
Correlation Engine NQ/ES-ES/NQ, MNQ/MES-MES/MNQ
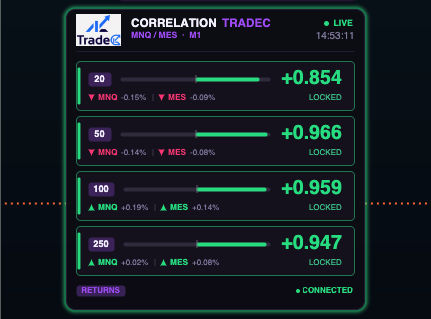
Correlation Engine gives you an instant view of the correlation between NQ/ES or MNQ/MES — without having to constantly monitor multiple charts. Track correlation across several lookback periods, spot shifts in market behavior, and quickly see whether the indices are moving together or beginning to diverge. The clean dashboard displays live correlation values, directional movement, and correlation strength in real time. Less chart switching. More context for better trading decisions. Set once: MNQ and MES side by side, both the same timeframe, indicator on both. Wait for the green CONNECTED. Normal: on M1, MNQ/MES is around 0.88–0.92. All four cards are green, arrows are in the same direction. This is the background — you don't look at it, you just register the side vision with your side vision. When to be alert — two things: The short window falls, the long one holds. The 20-bar card turns yellow or gray, while the 100 and 250 remain green. The markets are just diverging. Either it's the local noise of one instrument or the beginning of something. Arrows against each other + reinforced frame. One up, the other down. This is no longer noise, but a real divergence for the entire window. Which window to what: 20 —What is happening now, it is oscillating 50 — confirmation of whether the leg has a leg spacing 100 / 250 — context of the day; if these also fall, it's not an episode but a regime Practical reading: when you enter NQ and at that moment both arrows are the same and the short correlation is high, the entire index sector goes with you. When the short correlation is broken, only your instrument moves — on its own, without the support of the other market. Two habits that pay off: If you see a strange number, look at the footer first. Nine out of ten cases are a different timeframe, not a broken market. If the vibration of the 20-bar card disturbs you, turn on Closed bars only — the numbers then move until the candle closes.ATAS License RequirementTo ensure the indicator is correctly assigned to your ATAS account, you must enter the same email address during checkout that is registered with your ATAS license.This email is required so the indicator can be properly linked to your ATAS account.Important: If you enter a different email address, I may not be able to correctly assign the indicator to your ATAS license.ImportantThis indicator is a digital product/license intended for use with ATAS. After your purchase, the indicator will be assigned to the ATAS account associated with the email address provided during checkout.
$219.00
Initial Balance Classifier
Initial Balance Classifier
Know the size of the day. Trade with context.
Initial Balance is one of the key concepts for understanding the structure and potential behavior of a trading session. But knowing the IB range alone is not enough — you also need to know how that range compares to what is normal for the market.
Initial Balance Classifier gives you that context automatically.
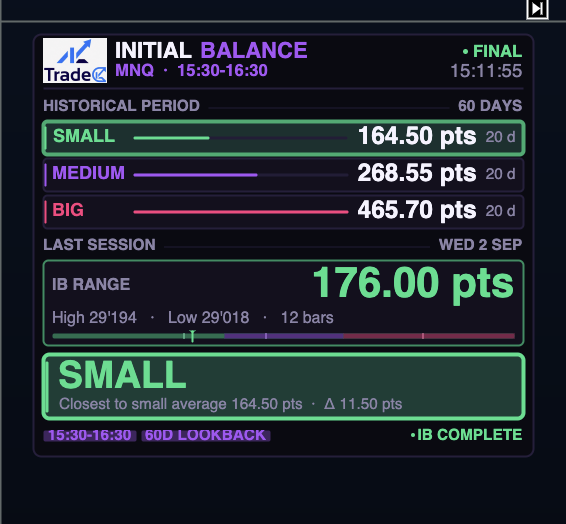
The indicator analyzes the Initial Balance range from previous trading days and classifies today’s IB as SMALL, MEDIUM, or BIG based on its historical distribution.
Simply choose how many previous trading days you want to analyze — with 60 days as the default — and define your Initial Balance period, for example 15:30–16:30.
Once today’s Initial Balance is completed, the indicator automatically compares it with the historical data and tells you where today’s range stands.
SMALL. MEDIUM. BIG.
SMALL IB — Today’s Initial Balance is relatively small compared to historical conditions.
MEDIUM IB — Today’s Initial Balance is close to the typical historical range.
BIG IB — Today’s Initial Balance is significantly larger than what is normally observed.
Instead of manually comparing today’s IB with dozens of previous sessions, you get the answer instantly in a clean and intuitive panel directly on your chart.
Historical Context at a Glance
The panel displays the historical average for Small, Medium, and Big Initial Balance, together with today’s current IB range and its classification.
Everything is presented in a simple visual format so you can understand the current market environment at a glance.
Key Features
• Automatic Initial Balance measurement
• Small / Medium / Big classification
• Historical analysis based on your chosen number of trading days
• Automatic calculation of Small, Medium and Big reference values
• Today’s IB automatically compared with historical data
• Fully customizable Initial Balance start and end time
• Uses your PC/platform time
• Automatic daily reset
• Works with historical and real-time data
• Clean, modern dashboard-style panel
• Fully customizable display settings
Why Use It?
The size of the Initial Balance can provide valuable context about the trading day.
A Small IB and a Big IB can represent very different market conditions — yet without historical context, it is difficult to know how significant today’s range actually is.
Initial Balance Classifier turns that historical context into a simple, actionable read.
Measure the range.
Understand the context.
Trade the day with better information.
Initial Balance Classifier — Know the size of the day.
ATAS License Requirement
To ensure the indicator is correctly assigned to your ATAS account, you must enter the same email address during checkout that is registered with your ATAS license.
This email is required so the indicator can be properly linked to your ATAS account.
Important: If you enter a different email address, I may not be able to correctly assign the indicator to your ATAS license.
Important
This indicator is a digital product/license intended for use with ATAS. After your purchase, the indicator will be assigned to the ATAS account associated with the email address provided during checkout.
$219.00
Delta Analysis Suite Pro
Delta Analysis Suite
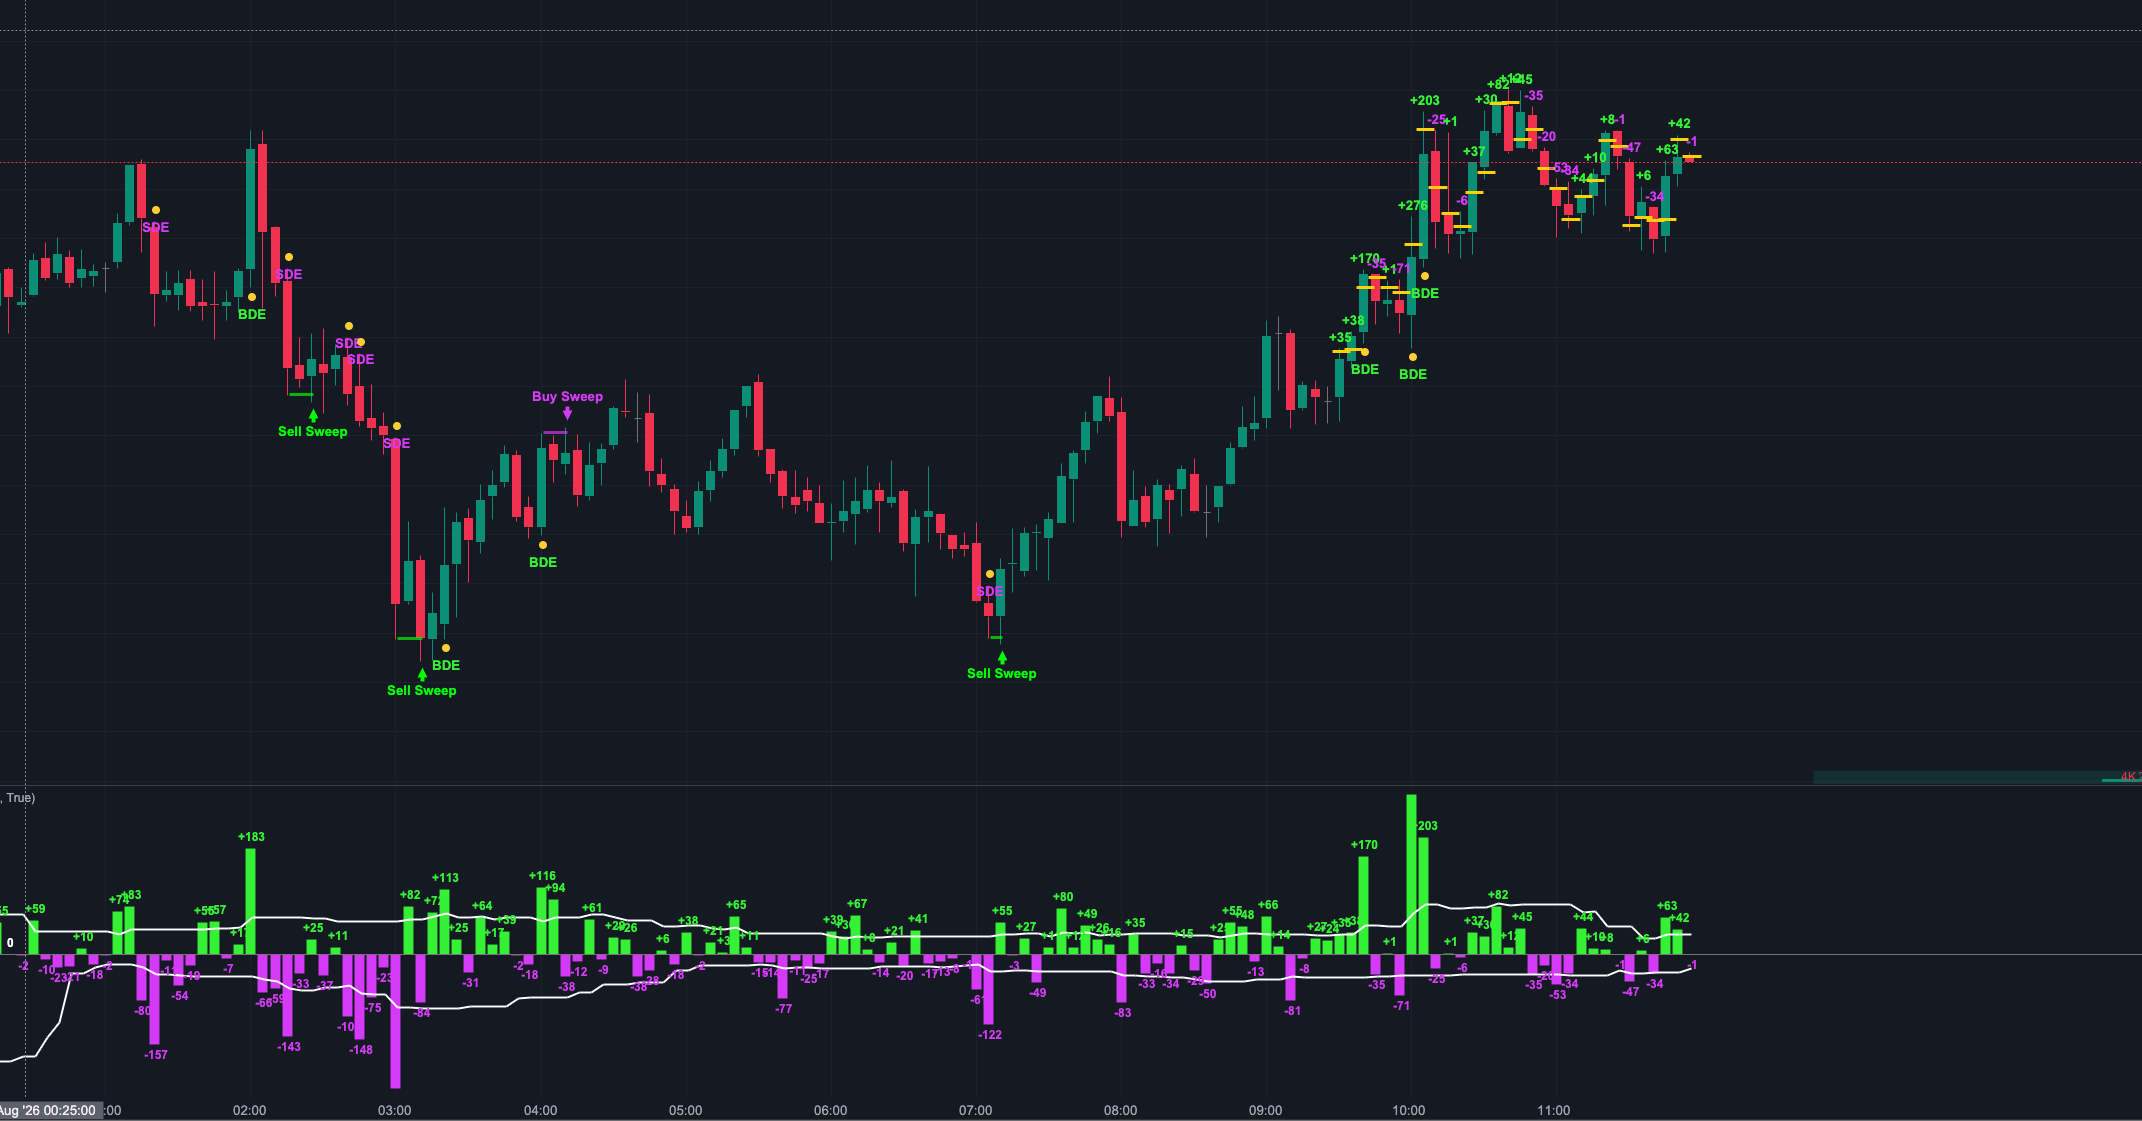
Delta Analysis Suite is a comprehensive order-flow indicator designed to analyze buying and selling pressure directly from candle delta and identify significant delta events and potential trading opportunities.
The indicator combines multiple delta-based tools into one system, allowing traders to quickly evaluate the strength of aggressive buyers and sellers and identify important order-flow situations in real time.
Key Features
* Candle Delta — displays the delta value of each candle directly on the chart, providing an immediate view of buying and selling pressure.
* Average Buy & Sell Delta — calculates and displays the average buy delta and sell delta, creating a dynamic benchmark for evaluating whether current delta is normal or unusually strong.
* Delta Extremes — identifies candles with exceptionally high positive or negative delta compared to the calculated average, highlighting areas of abnormal aggressive buying or selling.
* Extreme Absorption — detects extreme absorption situations where significant aggressive buying or selling is absorbed and subsequently overcome by the opposite side.
* Entry Signals — generates visual entry signals based on the combination of the defined delta conditions, helping traders identify potential high-quality setups directly on the chart.
* Live Analysis — the indicator works in real time while candles are forming, allowing delta extremes, absorption and entry conditions to develop and update live.
Why Use It?
Instead of looking at delta as a standalone number, Delta Analysis Suite turns delta data into actionable order-flow information.
It helps traders distinguish between normal market activity and significant aggressive buying or selling, while also highlighting absorption and potential entry opportunities.
ATAS License Requirement
To ensure the indicator is correctly assigned to your ATAS account, you must enter the same email address during checkout that is registered with your ATAS license.
This email is required so the indicator can be properly linked to your ATAS account.
Important: If you enter a different email address, I may not be able to correctly assign the indicator to your ATAS license.
Important
This indicator is a digital product/license intended for use with ATAS. After purchase, the indicator will be assigned to the ATAS account associated with the email address provided during checkout.
$249.00
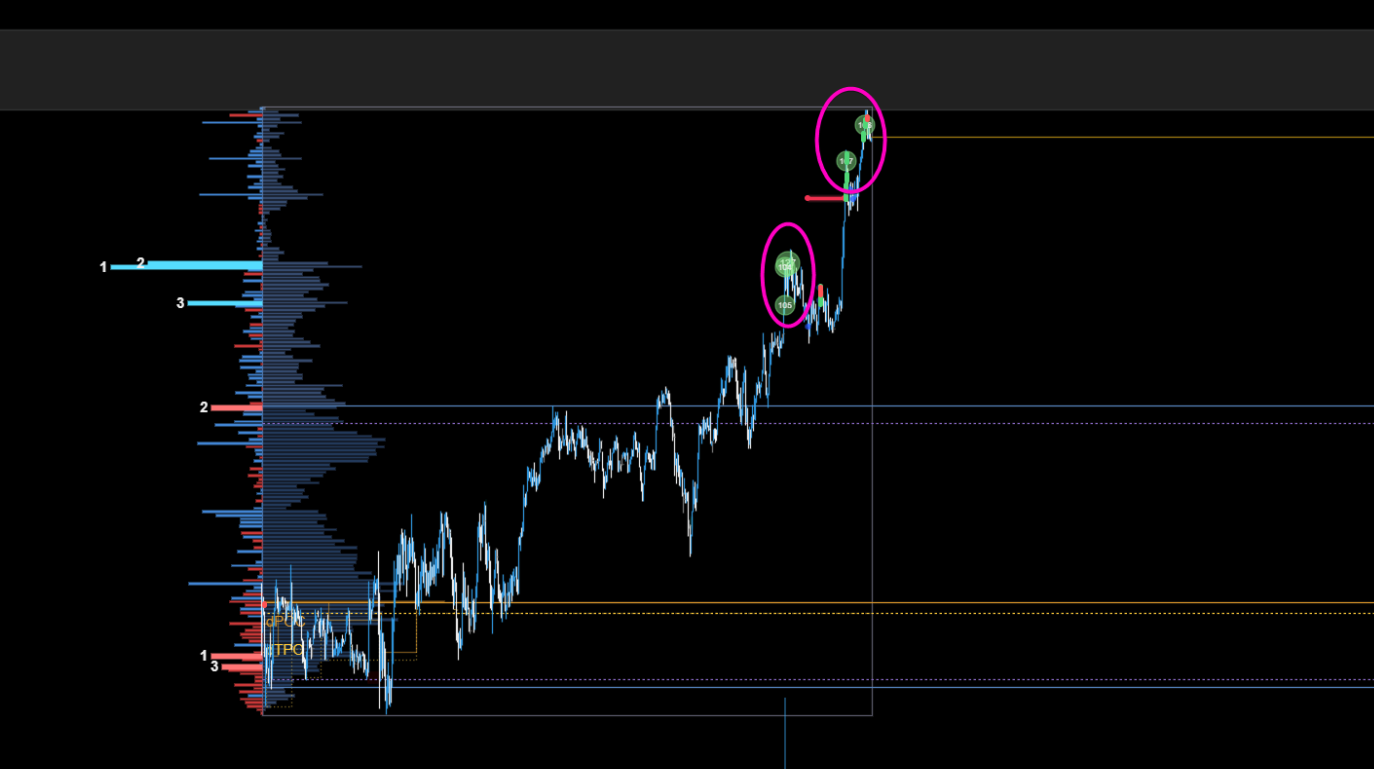
Session volume and tpo profile pro
Session Volume & TPO Profile
Session Volume & TPO Profile is a comprehensive session-based profile indicator designed to give traders a clear view of market structure, volume distribution and order-flow activity within a selected trading session.
The indicator combines Volume Profile and TPO Profile into a single visual tool and also provides real-time developing information as the session progresses.
Key Features
* Session Volume Profile — displays the distribution of traded volume throughout the selected session.
* TPO Profile — visualizes the time spent at each price level and provides a clear representation of the session’s market structure.
* Developing POC — continuously updates the developing TPO POC as the session develops.
* Developing VPOC — continuously updates the developing Volume POC (VPOC) in real time.
* Delta Zones — highlights important areas based on delta, helping identify areas of significant buying and selling pressure.
* Live / Developing Data — all key profile components can update live while the session is still forming, allowing traders to monitor how the profile develops in real time.
* Session-Based Analysis — allows traders to analyze individual trading sessions and understand how volume, time and order flow are distributed across price.
* Clear Visualization — designed to provide relevant profile information without unnecessarily cluttering the chart.
Why Use It?
The combination of TPO, Volume Profile, developing POC/VPOC and Delta Zones provides a complete picture of how the market is interacting with each price level.
Instead of analyzing only completed profiles, you can follow the development of the current session in real time and observe where the market is building acceptance, where volume is concentrating and where significant delta activity is occurring.
ATAS License Requirement
To ensure the indicator is correctly assigned to your ATAS account, you must enter the same email address during checkout that is registered with your ATAS license.
This email is required so the indicator can be properly linked to your ATAS account.
Important: If you enter a different email address, I may not be able to correctly assign the indicator to your ATAS license.
Important
This indicator is a digital product/license intended for use with ATAS. After purchase, the indicator will be assigned to the ATAS account associated with the email address provided during checkout.
$259.00
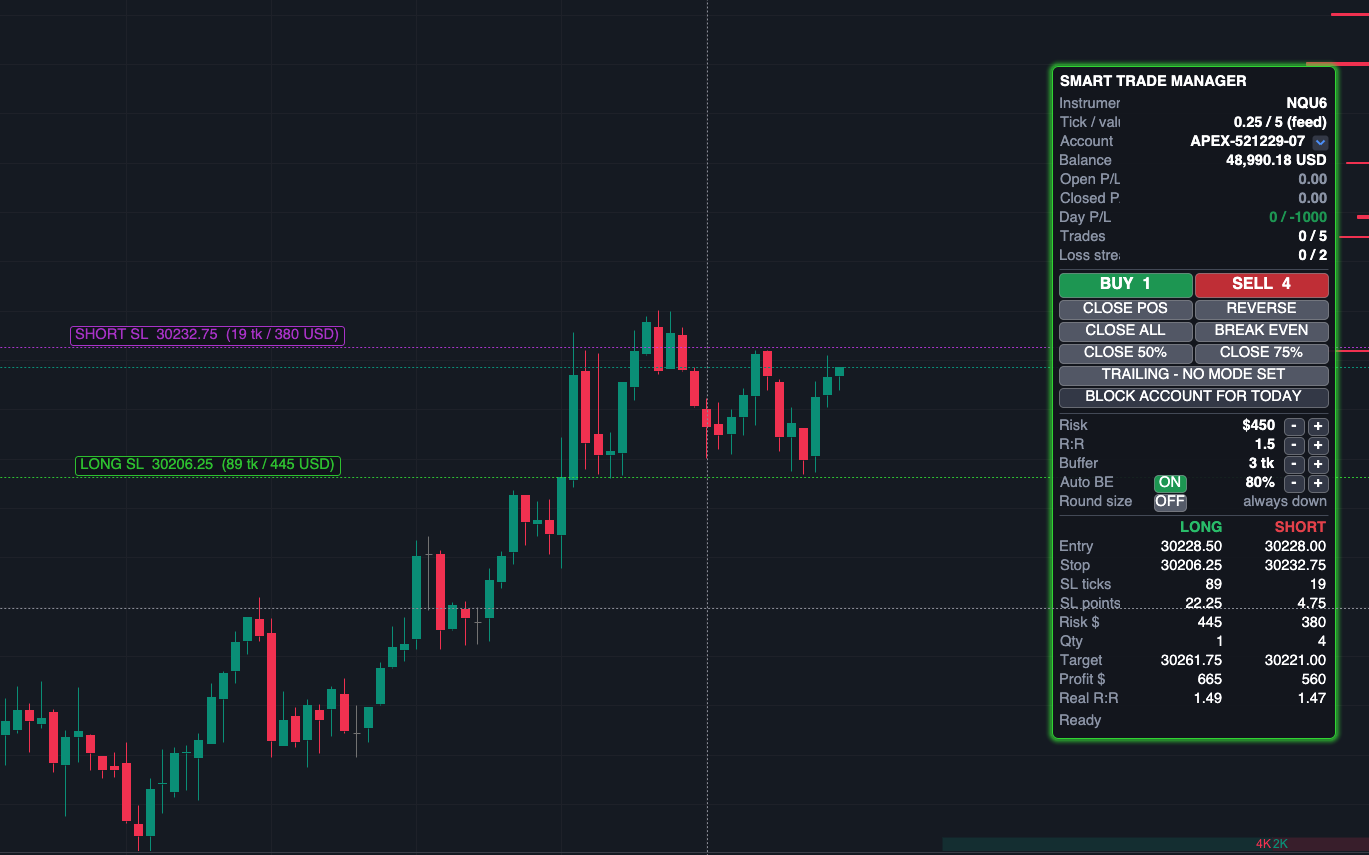
Smart Trade Manager
Trade Manager
Trade Manager is an advanced trade management tool designed to automate position sizing, risk management and position handling directly within ATAS.
The system is built to help traders maintain consistent risk while giving them full control over how trades are opened, protected and managed.
Key Features
* Automatic Position Sizing — calculates the optimal position size based on the distance from the current price to the nearest market structure or based on ATR.
* Structure & ATR Risk Calculation — you can use Structure, ATR, or both simultaneously when calculating the position size.
* Automatic Stop Loss & Take Profit — immediately after entering a position, the Trade Manager automatically places the SL and TP according to your predefined parameters.
* Automatic Breakeven — configure the conditions under which the position is automatically moved to breakeven.
* Risk Management — set your maximum daily loss, maximum number of consecutive losing trades, and maximum number of trades per day.
* Automatic Trading Lock — once one of your predefined risk limits is reached, the Trade Manager can automatically lock further trading to prevent additional losses.
* ATR Trailing — trail your position dynamically according to current ATR.
* Structure Trailing — trail the stop according to developing market structure.
* Fixed Tick Trailing — use a predefined number of ticks for fixed-distance trailing.
* Custom Buffers — configure additional buffers around structures, stops and other calculated levels to adapt the risk management to your strategy.
Advanced Trade Controls
Trade Manager also provides a range of quick and intelligent trade-management functions:
* Auto Account Lock
* Close All Positions
* Close Position
* Breakeven
* Reverse Position
* Custom Buffers
* Automatic Risk Protection
* Configurable Position Management
* Multiple trailing methods
* Additional customizable risk parameters
Why Use Trade Manager?
Trade Manager removes much of the manual work from trade execution and risk management.
Instead of manually calculating position size, placing SL and TP, monitoring daily risk and adjusting stops, the system can handle these tasks automatically according to your predefined rules.
This allows you to focus more on market analysis and execution, while keeping your risk management consistent from trade to trade.
ATAS License Requirement
To ensure the Trade Manager is correctly assigned to your ATAS account, you must enter the same email address during checkout that is registered with your ATAS license.
This email is required so the indicator can be properly linked to your ATAS account.
Important: If you enter a different email address, I may not be able to correctly assign the Trade Manager to your ATAS license.
Important
Trade Manager is a digital product/license intended for use with ATAS. After purchase, the license will be assigned to the ATAS account associated with the email address provided during checkout.
$399.00
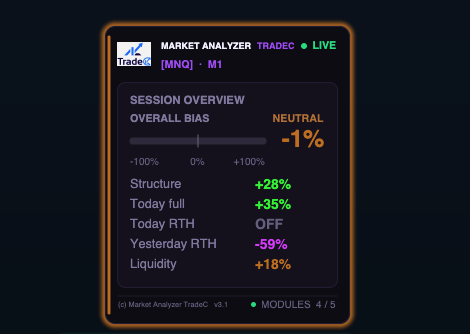
Market Analyzer
Market Analyzer turns complex market context into a clear, data-driven trading bias — without hours of manual analysis. It evaluates liquidity, today’s and yesterday’s RTH sessions, current market structure, and the development of the entire trading day. Built on auction-market logic, it combines volume, TPO, price positioning versus key levels, session behavior, and many additional market factors. The result is a clear Overall Bias that instantly shows whether market conditions favor a long, short, or neutral scenario. Less guesswork. More structure, context, and confidence behind every decision.ATAS License RequirementTo ensure the indicator is correctly assigned to your ATAS account, you must enter the same email address during checkout that is registered with your ATAS license.This email is required so the indicator can be properly linked to your ATAS account.Important: If you enter a different email address, I may not be able to correctly assign the indicator to your ATAS license.ImportantThis indicator is a digital product/license intended for use with ATAS. After your purchase, the indicator will be assigned to the ATAS account associated with the email address provided during checkout.
$749.00
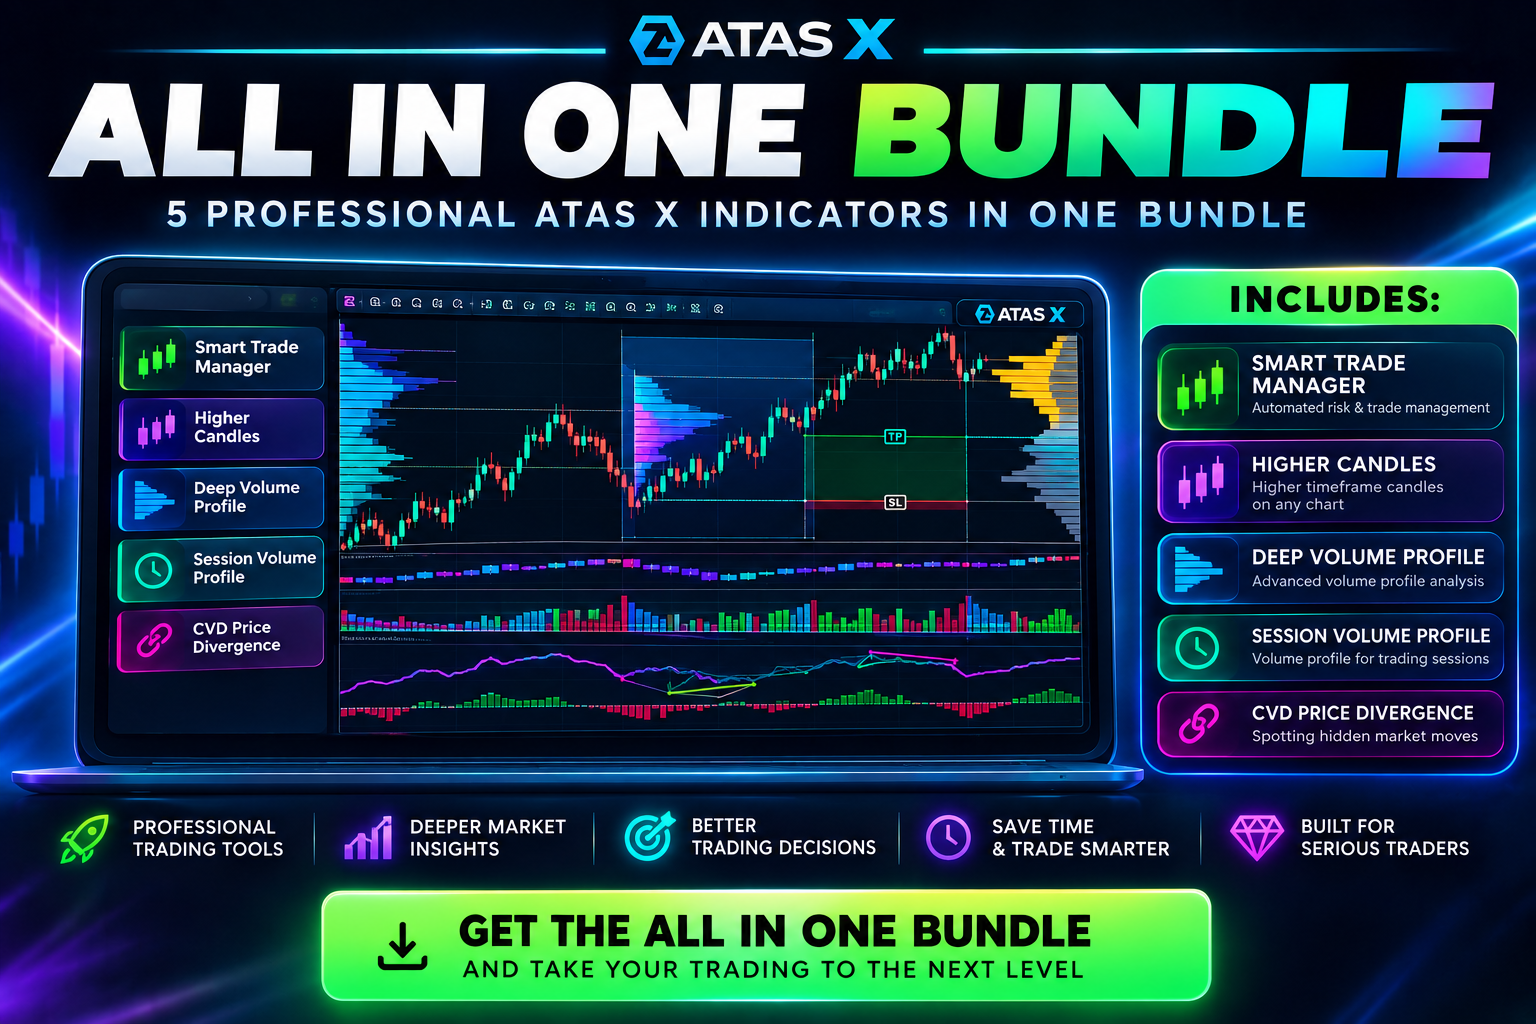
ATAS X All-in-One Bundle
Get everything you need for professional order flow and market analysis in one powerful bundle.
Includes:
- Smart Trade Manager
- Higher Candles
- Deep Volume Profile
- Session Volume Profile
- CVD Price Divergence
Lifetime License — one payment, lifetime access.
Five professional indicators. One complete trading toolkit.
ATAS License Requirement
To ensure the indicator is correctly assigned to your ATAS account, you must enter the same email address during checkout that is registered with your ATAS license.
This email is required so the indicator can be properly linked to your ATAS account.
Important: If you enter a different email address, I may not be able to correctly assign the indicator to your ATAS license.
Important
This indicator is a digital product/license intended for use with ATAS. After your purchase, the indicator will be assigned to the ATAS account associated with the email address provided during checkout.
$899.00
Bias Bundle
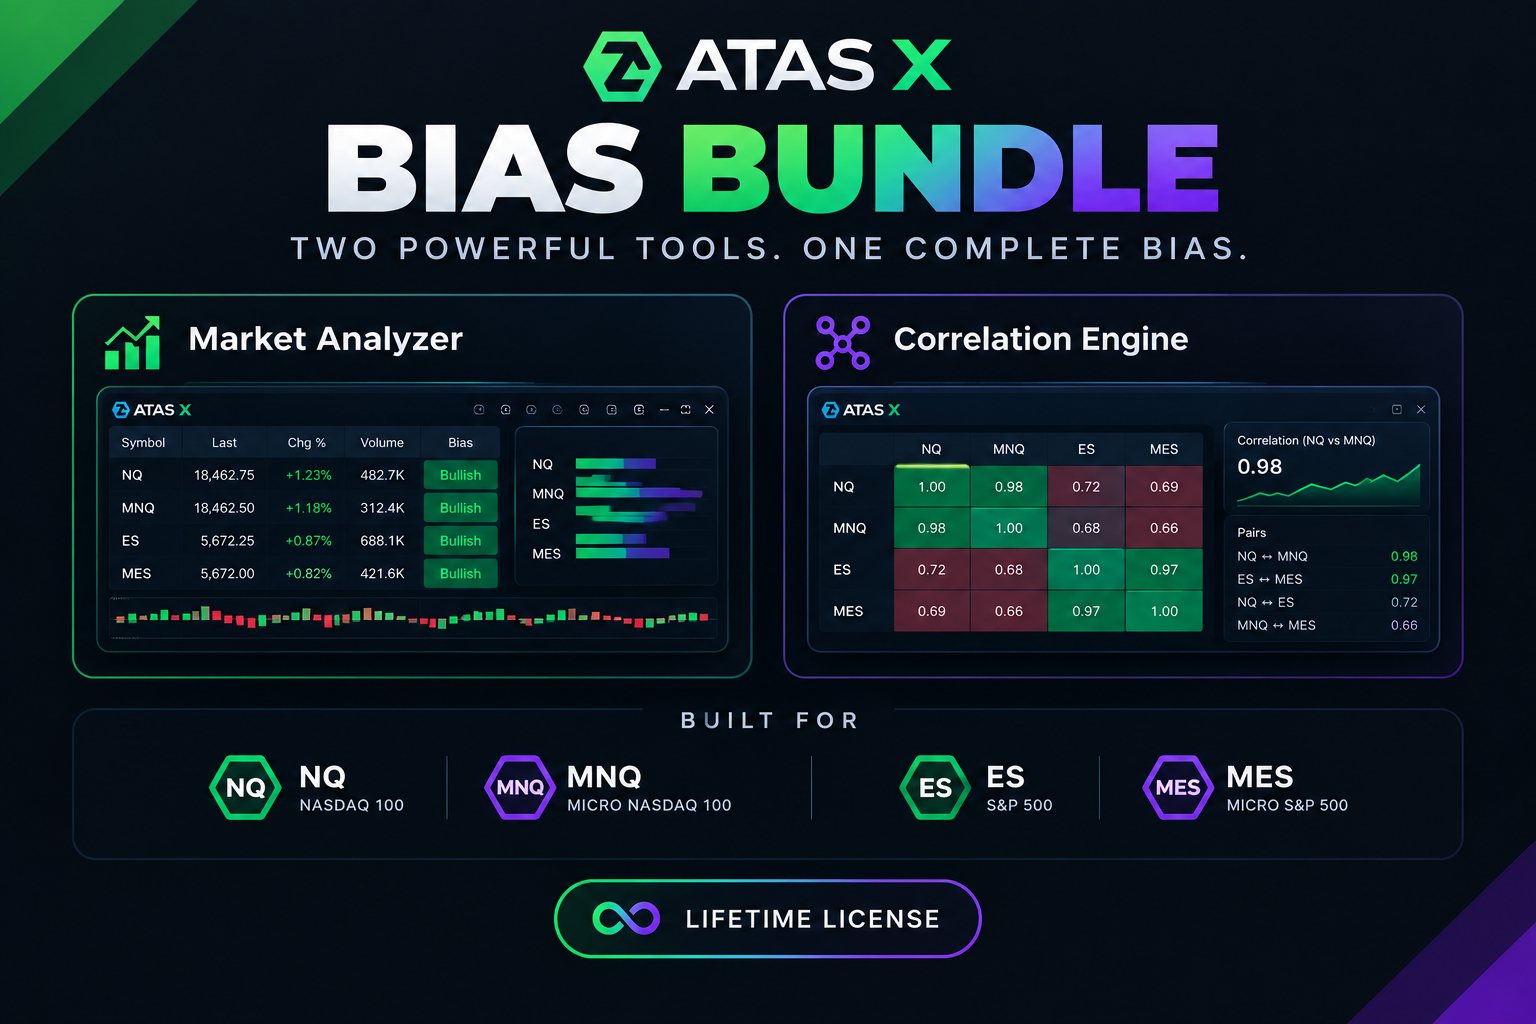
Two advanced indicators. One complete market view. Get Correlation Engine and Market Analyzer together in one bundle — built for traders who want faster, more informed decisions without constantly switching between charts. Correlation Engine tracks the relationship between NQ/ES or MNQ/MES across multiple lookback periods. Instantly see whether markets are moving together or whether correlation is weakening and divergence is emerging. Market Analyzer builds the broader market picture: it evaluates liquidity, today’s and yesterday’s RTH sessions, market structure, volume, TPO, price positioning versus key levels, and additional auction-market factors. It then turns this information into a clear Overall Bias for long, short, or neutral conditions. One indicator shows you the relationship between markets. The other gives you the market’s context and directional bias. Together, they provide a complete framework for reading the market — quickly, clearly, and without unnecessary noise. Pay once and get both indicators in one value-packed bundle.ATAS License RequirementTo ensure the indicator is correctly assigned to your ATAS account, you must enter the same email address during checkout that is registered with your ATAS license.This email is required so the indicator can be properly linked to your ATAS account.Important: If you enter a different email address, I may not be able to correctly assign the indicator to your ATAS license.ImportantThis indicator is a digital product/license intended for use with ATAS. After your purchase, the indicator will be assigned to the ATAS account associated with the email address provided during checkout.
$899.00